
Loading documentation
Loading documentation
Home, Stats, Positions and Leaders. What every screen does and what the numbers mean.
AROUND THE APP
Five sections: Home, Brain, Stats, Positions and Leaders. This page covers what each one does. The Brain has its own page, so it only gets a mention here.
The three controls at the top
These sit above every page and apply everywhere. Set them once and Home, Stats and Positions all follow.
All Trades is the date range. Presets for today, the last 7, 30 or 365 days, or your last 100 trades, plus a calendar if you want your own window. Leave it on All Trades to see everything.
Global Filters narrows by symbol, size and side. Useful when you want to look at one coin, or only your shorts, without the rest of the book muddying it.
Accounts shows how many exchanges you have connected, and it's where you add another.
Home
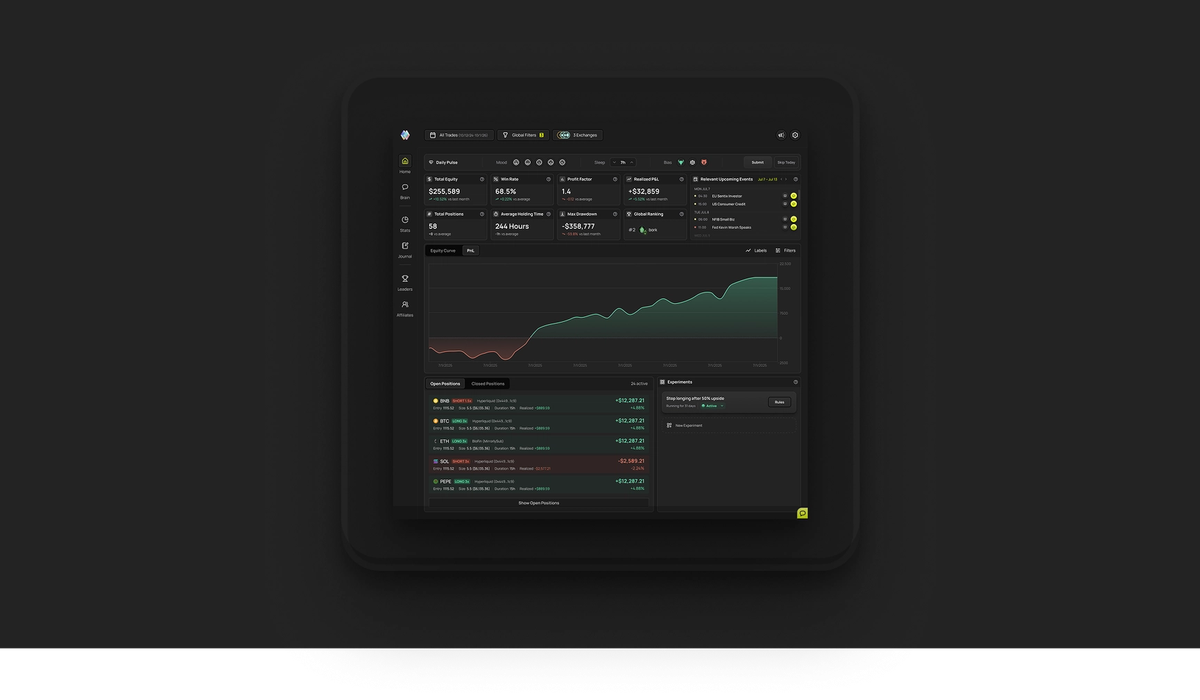
The overview. Top strip is your Daily Pulse, the three-question check-in: mood, hours slept, market bias. Answer it or skip it. Answered daily it lets the Brain line your state up against how you actually traded.
Below that, eight cards covering equity, realized PnL, win rate, profit factor, total trades, average holding time, max drawdown and net exposure. Each has a small question mark that explains what it measures.
Then open positions on the left, recent closes on the right, an equity and PnL chart under those, and the events calendar showing what's coming that tends to move your book. The relevant events toggle filters it down to things that matter for what you actually trade.
At the bottom, Rank Overview shows where you sit against other traders this month. Reflekt on it hands your standing to the Brain and asks it to explain what's driving the number and what would move it.
Stats
Everything on Home, plus the parts that need more room.
Same headline cards with a few extras, largest win, largest loss, average trade return. Widgets in the top right lets you add and remove cards, so you can strip it down to what you actually look at.
Equity Curve and PnL Curve sit side by side, each with its own date range.
Time Based Performance is the interesting one. A grid of every day of the week against every hour, showing where you win and where you do not. This is where you find out you are fine in the morning and hopeless after 9pm, or that one day of the week is quietly carrying you. Next to it, most profitable day, most profitable time, best holding times, and how your limit orders compare.
Cost Analysis breaks out taker fees, maker fees and funding. Most traders underestimate this one. It is not a single bad trade, it is a slow bleed that only shows up when you total it.
Positions
Every position, open and closed, on two tabs.
Closed positions show the pair, direction, when it opened and closed, entry, max size and realized PnL in both dollars and percent. Sortable, paginated, and it respects whatever you set in the filters up top.
This is the page for going back over a specific stretch rather than looking at aggregates.
Leaders
The global leaderboard, ranked monthly, weekly or all time. You are on it from the moment you connect, ranked on PnL, win rate and profit factor.
Verify yourself connects your X account so your numbers are publicly attached to your handle. Skip it and you stay under your nickname with nothing tracing back to you.
Brain
The chat. Everything above tells you what happened. The Brain tells you why it keeps happening.
Your conversations are saved in the sidebar, so you can pick up where you left off. It is one shortcut away from anywhere in the app, Ctrl+K or the button at the bottom of the screen.
How to use the Brain covers what to ask and why talking to it matters.